The Housing Recovery is a Farce
Home sales and new home construction are down. Home sales to first time home buyers are at historic lows, yet many believe there is a housing recovery. The charts tell a different story.
Since the start of Smaulgld.com we have been covering the housing recovery noting that it has been characterized by higher home prices but low sales, low new home construction, low inventory, low household formation and low participation by first time home buyers and millennials.
The economic recovery has been touted in terms of stock and real estate market gains while employment and wage growth have been non existent. During the housing “recovery” the home ownership rate has fallen to an eighteen year low.
We have blamed this unsustainable high price/low sales housing “recovery” dynamic on the Federal Reserve’s quantitative easing programs (QE) whereby the Fed buys trillions of dollars worth of U.S. Treasuries and Mortgage Backed Securies (MBS’s) from the Too Big Too Fail (TBTF) banks with money they print out of thin air with the ostensible purpose of stimulating the economy by keeping interest rates low. In reality, QE has been an enormous continuation of the 2008 Troubled Assest Relief Program (TARP) bailout whereby the Fed continues to remove MBS’s from the TBTF banks’ balance sheets by spending trillions of dollars to buy them from the TBTF banks.
We have criticized Federal Reserve Chair Janet Yellen’s contention that QE is not just for rich people by pointing out the gains in the economy have been in the stock and real estate markets, places where rich people keep their money. We have noted the gains in the stock and real estate markets do not reflect the strength of the underlying economy, but rather mask the disconnect between the poor labor market and rising stock and real estate prices.
The following charts show that the U.S. is not building many homes, not selling many homes and the ones that are selling are being sold, not to traditional buyers of homes – home buyers who have the financial wherewithal to qualify for mortgages – but rather to cash investors taking advantage of QE’s low interest rates. Indeed, cash investors have constituted between 40-50% of all home purchases in the past year and in some states, over 60%. We have predicted that since the economic “recovery” has been predicated on higher stock and real estate prices, that a decline in the stock market will bring down the real estate market and the entire economy and the talk of “recovery” will cease.
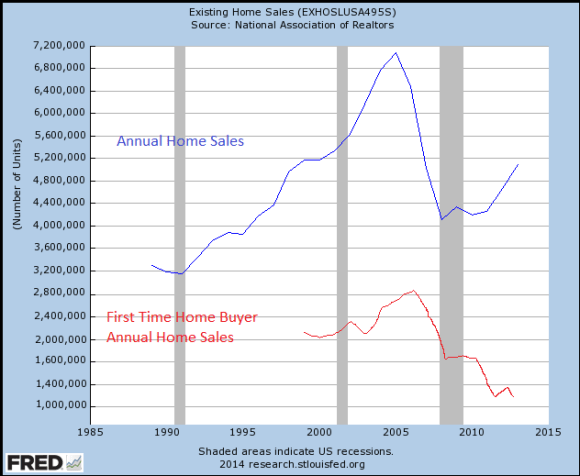
Annual Existing Home Sales vs. Annual Existing Home Sales By First Time Home Buyers
This chart shows annual existing home sales data (represented by the blue line) from the National Association of Realtors since 1988. It also shows the approximate number of homes sold to first time home buyers (represented by the red line) since 1999. Based on long term averages, we approximated that 40% of home sales from 1999-2010 were to first time home buyers. For the years 2011-12 we approximated that 30% of home sales were to first time home buyers and for 2013 that 27% of home sales were to first time home buyers.
The chart shows that while there has been a modest increase in the number of homes sold in the past few years, it also shows a massive decline in homes sold to first time home buyers. With out an improvement in overall economic conditions, especially the economic prospects of millennials (the current generation of potential first time home buyers), the mid and long term prospects for the real estate market are dim.
New Home Sales
This chart shows the abysmal number of new homes built in the past few years. News reports like to tout the large percentage increase of new homes built from prior recent years. The chart below, however, shows that these increases are coming off historically low new home construction numbers. Indeed, fewer new homes have been built in the past three years than during similar periods in the 1960’s and 1970’s when the U.S. population was approximately 36 and 28 percent lower, respectively.*
*the current U.S. population is approximately 317 million. The U.S. population was approximately 226 million in 1980 and 203 million in 1970.


 Send Litecoin to this address:


